Wednesday, December 31, 2014

Stagflation, Anyone?

Print Friendly

Remember the 1970s? It was known as the “Me Decade” and for bad music (disco). Among the other, more significant developments was “stagflation”: a period of stagnant economic growth, soaring inflation and, as a consequence, high unemployment.

Stagflation has edged back into the conversation about the economy and markets this month. First, the World Bank lowered its projected global growth rate for 2014 to 2.8 percent from its previous 3.2 percent. Then the International Monetary Fund lowered its forecast for U.S. growth from 2.8 percent to 2 percent.

This week, the final revision for the U.S. economy’s performance in the first quarter of 2014 came in at a dismal -2.9 percent, even worse than the pessimistic consensus.

Based on the general tenor of economic reports over the last three months, growth likely rebounded to an annual rate approaching 3 percent in the current quarter and could do so again in the July-September period.

After that, it’s anybody’s guess, particularly with the Federal Reserve gradually tapering its monthly purchases of Treasury and mortgage securities. We have yet to see 3 percent annual growth in the current economic recovery, which is now entering its sixth year.

In addition, job growth remains sluggish, with the decline in the official unemployment rate to 6.3 percent attributable in large part to the many people who have left the work force.

Meanwhile, prices of most commodities are up sharply in 2014. Energy, agriculture and precious metals led the way, with only industrial metals faltering. Prices for food, health care, heating/AC and more have climbed meaningfully. No doubt, many of you have noticed shrinking portions of various supermarket products, just like in the inflationary ’70s.

Last week, we heard that the consumer price index (CPI) is now up 2.1 percent over the last 12 months through Ma! y, and 2 percent excluding food and energy.

This week brought the latest numbers for the Federal Reserve’s favorite inflation gauge, the core personal consumption expenditure (PCE). Core PCE gives more weight to health care and less to housing. Over the past 12 months, the PCE has climbed 1.8 percent, and the core PCE, again excluding food and energy, is up 1.5 percent.

Either way, it’s widely acknowledged that the official government numbers understate inflation, partly because of changes made in the calculation methods over the years.

In other words, inflation indeed is dormant if you don’t eat, don’t drive, don’t send kids to college, don’t need healthcare and don’t breathe. 

What Lies Ahead?

Over the past 20 years, the CPI has averaged 2.4 percent, far from the double-digit levels of the late 1970s. So the current level of inflation is near the long-term trend.

Better economic growth seems likely in the near term, in the U.S. if not elsewhere. Our job market, as defined by qualified workers, may be tightening. The movement to raise the minimum wage is gathering momentum.

By historically normal measures, economic growth of 2.5 percent a year (we hope); 2 percent inflation, which is the Fed’s target rate; and a 6.3 percent unemployment rate would call for a more normal monetary policy.

In theory, that should lead the Fed to start raising its benchmark short-term interest rate as soon as the first quarter of 2015, earlier than most people currently expect. That rate has remained in the zero-0.25 percent range since December 2008.

We see three counter arguments. First, the Fed likely has to risk acting too late before hiking its short-term rate. Reason: If economic growth falters, the need for easier money could increase again, leading the Fed to reverse course.

Second, inflation is considered primarily a monetary phenomenon by many. In other words, it comes from “too much” mo! ney chasi! ng goods and services. Currently, all too much money is doing nothing: Money velocity is low despite the Fed’s aggressively easy policies.

Third, aging societies tend to grow more slowly than when their populations were younger. To a lesser extent, the US is now experiencing what has been happening in Europe and Japan for some time.

Bond investors, arguably the most inflation-sensitive, aren’t worried yet. Fixed-income yields are depressed in much of the world, including the 10-year U.S. Treasury issue down nearly 2.5 percent.

Tuesday, December 30, 2014

Civeo Gets Gutted by Oil Prices

The bear market in crude oil has claimed yet another victim.

Late Monday, Civeo (CVEO), the provider of temporary and long-term accommodation to oil projects, issued a steep profit warning and suspended its dividend payment. Tuesday, the stock cratered, falling more than 50% to $4.11.

The firm said it expects 2015 revenues between $540 million and $600 million, well below the $815 million analysts were expecting. Its first quarter revenue guidance, a range of $160 million to $175 million, also came in far short of expectations of $228 million.

The company blamed a slowdown in oil sands projects in Canada amid an environment of low oil prices for the shortfall, while also noting that low coal prices in Australia are also hurting sales.

In response, Sterne Agee analysts Stephen Gengaro and Ivan Suleiman wrote:

Civeo's near-term strategy of suspending its dividend and paying down debt is prudent and will enable the company to remain compliant with its debt covenants. Management expects 2015 capital spending of $75-85 million versus $260-280 million in 2014, including $55-60 million of maintenance. With about $250 million in cash on its balance sheet and our expectation the company is cash flow positive in 2015 even with depressed expectations, the company should be able to lower its debt levels to $450-500 million.

Civeo's share price was already under severe pressure before the profit warning. The shares hit a previous 52-week low of $6.81 on Dec. 17, a fall of more than 75% since it hit a high in June following its spinoff from Oil States International (OIS).

Apple and Google Show That Stock Splits Are Cool Again

Apple Reports Quarterly Earnings Spencer Platt/Getty Images It seems as if tech darlings don't want to scare off potential investors with sticker shock. Last Wednesday Apple (AAPL) became the latest company with a hefty share price to declare a stock split, agreeing to exchange every single share for seven shares trading at a much lower price. Stock splits are zero sum games. If an investor has 100 shares of Apple with the stock at $560 at the time of the 7-for-1 split, that investor would own 700 shares with a stock price of $80. But no matter how you slice it, the math still results in a $56,000 stake in the consumer tech giant. However, many think that there's a psychological benefit to having a stock appear to have a lower price. Apple isn't alone. Google (GOOG) also recently completed what was in effect a 2-for-1 stock split by giving investors a new share of non-voting stock for every share that they owned at the time. With Apple and Google validating the practice, don't be surprised if more stocks with large share prices go this route. A Split by Any Other Name Apple executed 2-for-1 stock splits in 1987, 2000 and 2005. It was quick on the trigger whenever its stock approached high double digits or poked its head into triple digits. However, the stock splits went away after that. Apple's stock continue to shoot higher as the iPod grew in popularity, followed by the introduction of the iPhone in 2007 and the iPad a few years later. Why did the company alter its behavior? The best bet is that Google changed the game when it went public around the time of Apple's final stock split. Google wanted to go public at a price that was as high as $135 during the summer of 2004. It had to settle for $85, but the message was clear: Google wasn't going to try to cater to conventional whims where companies would perform pre-IPO splits in order to hit the market at more accessible prices between $10 and 30. Google's reluctance to declare stock splits through nearly 10 years of trading let everyone know that it was in a race to hit the highest share price possible. It finally gave up the game a few weeks ago when it broke through the $1,000 ceiling, announcing a spinoff that was essentially a 2-for-1 stock split. Google's move now leaves just four stocks trading for more than $1,000 a share. The Rise and Fall and Rise of Stock Splits Stock splits were fashionable in the late 20th century. Retail investors were buying stocks in round lots of 100 shares at a time, and a company didn't want to limit its appeal. Individual investors who had just $20,000 to invest in a new stock would gravitate to 100 shares of a stock at $20 than to buy 20 shares of a stock at $100. Even today, some investors argue that a stock price can be too high. Market cap is the product of a stock's price and the number of shares outstanding. The stock price on its own is immaterial. A stock can be expensive if it's overvalued relative to its fundamentals, but there's really no such thing as a share price that is too high on its own. It's true that the greatest investor of our time is not a fan of stock splits. Warren Buffett has refused to declare a stock split on Berkshire Hathaway (BRK-A), though he reluctantly went on to offer a new class of shares (BRK-B) at a lower price several years ago. However, with the exception of a handful of successful companies, most companies don't like to see their prices get too high.

Monday, December 29, 2014

Men's Wearhouse Starts Tailoring Its Merger for Savings

Now that the drama of its $1.8 billion acquisition of Jos. A. Bank (NASDAQ: JOSB  )  is largely behind it, Men's Wearhouse (NYSE: MW  ) is turning to the task of figuring out just how it's going to make good on its promise to eliminate $100 million to $150 million in costs over three years. Although it still has to gain regulatory and shareholder approval before an expected fourth-quarter closing date, effecting the synergies it sold investors on as the plausible reason for paying a high price for its rival remains the largest hurdle ahead.

To help realize those financial goals, Men's Wearhouse announced the other day that it hired the advisory firm AlixPartners to support the integration process. Although this merger is seemingly one of those brain-dead simple combinations, teasing out savings really isn't going to be as clear-cut as it seems.

The combination of the two retailers will create the fourth largest retailer of menswear, behind department-store chains Macy's (NYSE: M  ) , Kohl's (NYSE: KSS  ) , and J.C. Penney (NYSE: JCP  ) with 1,700 stores, 23,000 employees, and pro forma sales of $3.5 billion. Yet Men's Wearhouse has rightly said it's not going to rebrand Bank's stores in recognition of the two companies' separate customer bases and different corporate cultures.

Where Jos. A. Bank retains the more classic lines, Men's Wearhouse revels in its trendier image. Because of that, the ability to cut costs by closing stores won't be readily available to management. While there will be supply-chain efficiencies realized, along with advertising costs and duplicative corporate functions eliminated, because there are different cultures to mesh together, expect there to be friction.

Recently Men's Wearhouse founder and ex-CEO George Zimmer commented that while he's generally supportive of the merger, he also cautioned he's seen too many of them fall apart because of tenacious cost-cutting, giving voice to concerns I've also expressed that this deal may yet come undone.

There are positive outcomes possible and perhaps even probable from this merger. An extension of Men's Wearhouse's profitable tuxedo rental business, for example, could open up for Jos. A. Bank a whole new revenue base. And by not rebranding the stores it won't have to remodel them, either, which should be a cost savings.

There's still a lengthy road ahead, but I'm certain there will be more than a few bumps along the way, which is why I'm not ready to say this matchup will be seamless.

Tailor the Motley Fool's top stock to boost your portfolio's returns
There's a huge difference between a good stock and a stock that can make you rich. The Motley Fool's chief investment officer has selected his No. 1 stock for 2014, and it's one of those stocks that could make you rich. You can find out which stock it is in the special free report "The Motley Fool's Top Stock for 2014." Just click here to access the report and find out the name of this under-the-radar company.

Sunday, December 28, 2014

Dec. housing starts end strong in 2013

Housing starts fell sharply last month but they remained strong enough to give builders their best year since 2007, the Commerce Department said Friday.

Starts fell 9.8% to a seasonally adjusted annual pace of 999,000 in December following a surge in November to the highest level of the year -- 1.1 million. December's rate was the year's third highest.

The government estimated 923,400 homes and apartments were started last year. That's more than 18% above the 2012 figure of 780,600.

In 2007, housing starts totaled nearly 1.4 million.

Applications for building permits, a barometer of future activity, fell 3% in December. Applications for permits to build single-family homes fell 4.8% while applications to build apartments were unchanged.

Friday's numbers follow Thursday's report showing U.S. home builders losing a little confidence this month.

The National Association of Home Builders/Wells Fargo builder sentiment index dipped to 56, down slightly from December, but the index is still higher than where it was a year ago. Readings above 50 indicate more builders view conditions as good than poor while those under 50 point to pessimism.

Rising home prices and pent up demand will drive a gradual recovery in the year ahead, says David Crowe, chief economist of the National Association of Home Builders.

NAHB predicts single family construction to hit 820,000 units this year. That's still far off the 1.3-million a year pace in the years leading up to the housing bubble and bust.

Construction of multi-family units will come closer to normal with 326,000 units this year vs. a more historical norm of 340,000, NAHB says.

NAHB doesn't expect the home building sector to fully recover until 2016.

"We are getting there but it's not a fast process," Crowe says.

Overall, housing and economic activity is now back to normal in 56 of 350 metropolitan areas nationwide, shows the latest NAHB/First American Leading Markets Index.

That index tracks ho! using permits, home prices and employment data. Major metros topping the list include Baton Rouge, La, Honolulu, Austin and Houston, Texas.

Follow me on Twitter @JulieSchmit


Home building recovering

Annual construction starts of single-family homes and multi-family buildings, in millions:

Sponsored byStarts
Year 0,1.85 1,1.96 2,2.07 3,1.80 4,1.36 5,0.91 6,0.55 7,0.59 8,0.61 9,0.78 10,0.92
YearSource: U.S. Census Bureau from Haver Analytics

Stocks and 2013: A profitable year to remember

NEW YORK — The stock market is on track to wrap up its best year since 1997, showering investors with a 29% gain in a record-breaking run that might finally have convinced investors scared off by the 2008 financial crisis that stocks remain a viable investment alternative.

"It was a great year, one for the record books," says Alan Skrainka, chief investment officer at Cornerstone Wealth Management.

Nothing, it seemed, could slow the stock market's profitable run in 2013. The Boston Marathon terrorist bombing didn't dent investors' resolve. Nor did political turmoil in Egypt. Or a near U.S. military confrontation with Syria.

Similarly, a sharp spike in yields on U.S. government bonds and rising anxiety over an eventual shift to a less market-friendly Federal Reserve policy couldn't spark a stock market downturn, either. Investors also shrugged off electronic glitches at stock exchanges, ongoing economic worries, and a government shutdown.

2014 OUTLOOK : Will it be another slam dunk for stocks?

TOP PICKS: Stock picks by top investment strategists for 2014

The year "saw a downsizing of fear," says David Kelly, chief global strategist at J.P. Morgan Funds. "A lot of people's fears diminished, and that allowed money to come back into stocks."

Wall Street historians had a busy year as the record books had to be rewritten.

With just one trading day left in 2013, the 117-year-old Dow Jones industrial average, which was powered by the Fed's easy-money policies and an improving economy, has notched 51 record closes, including a fresh all-time high of 16,504.29 on Monday. It is up 25.9%, on track for its best annual performance since 1996.

The benchmark Standard & Poor's 500 index notched 44 new highs, and is up 29.1% at 1841.07 and on track for its best gain in 16 years. The Nasdaq composite performed like it did in the go-go 1990s, soaring 37.6% to 4154.20, a level not seen since September 2000.

The small-cap Russell 2000 also hit new-high territo! ry in 2013, gaining 36.6%. All told, the stock market has seen a paper gain of roughly $5.3 trillion, according to Wilshire Associates.

Stock futures pointed to a somewhat uninspired finish to such a banner year. Ahead of the start of the last trading session of 2013, Dow Jones industrial average index futures, Nasdaq composite index futures and Standard & Poor's 500 index futures were basically unchanged.

BOND FUNDS: Investors got a lump of coal in 2013

MUTUAL FUNDS: Investors celebrate 2013 with 32% gains

Along the way, stock investors got a few breaks.

To start the year, squabbling Democrats and Republicans signed off on an 11th-hour deal that helped the economy avert the worst of the "fiscal cliff," a mix of government spending cuts and tax hikes. And despite fears that the Fed would dial back on its market-friendly bond-buying stimulus program, the central bank held off and said it won't start phasing out its stimulus until January 2014, a delay that enabled the economy and job market to gain steam and U.S. companies to post record earnings.

The nation also averted war with Syria and sidestepped other geopolitical landmines in places such as Iran and Egypt.

With fears receding, investors gained confidence and bid up stock prices. They were willing to pay more for each dollar of a company's earnings, resulting in rapid price appreciation. A key valuation metric, the price-to-earnings ratio, or P-E, of the S&P 500 swelled from 14 times companies earnings over the past 12 months at the start of 2013 to nearly 17 times by year's end, according to Terry Sandven, chief equity strategist at U.S. Bank Wealth Management.

"We are ending 2013 in a good place," says Sandven. "The global economy is in slow-growth mode. Interest rates are low. Inflation is contained. And corporate earnings are rising. Typically, that presents a favorable environment for stocks."

Nobody expected the big gains in 2013, "proving you can't time markets," adds Kelly.

How swe! et it was on Wall Street

How the major U.S. stock indexes performed as of Dec. 30:

Standard & Poor's 500: 29% gain (Best since 1997)

Dow Jones industrial average: 26% gain (Best since 1996)

Nasdaq composite index: 38% gain (Best since 2009)

Russell 2000: 37% (Best since 2003)

Source: USA TODAY research; Bespoke Investment Group

Saturday, December 27, 2014

The Ten Most Important Earnings This Week

This week will be a busy one as far as earnings, but this is also marks the beginning of the end for corporate earnings. We also still have some DJIA components reporting earnings, but the bulk of the majors have reported earnings and we are down to off-quarter companies now.

24/7 Wall St. compiled what it believes will be among the most watched earnings report this week. Earnings and revenue estimates are from Thomson Reuters and color has been added on each if applicable.

Best Buy Co. Inc. (NYSE: BBY) is due on Tuesday morning before the open. Investors will want to pay close attention here. The death of this company was over-reported, and the stock is up about 300% so far in 2013. This last quarter is considered close to a throwaway quarter with estimates at $0.11 EPS and $9.36 billion in revenue. The coming all-important quarter includes Christmas and the holidays and that is expected to be $1.66 EPS and $14.97 billion in revenue. At $44.10 late on Monday, the 52-week range is $11.20 to $44.66.

Medtronic Inc. (NYSE: MDT) reports on Tuesday morning and this medical device company is close to all-time highs all over again. Earnings estimates are $0.90 EPS and $4.18 billion in revenue. Medtronic’s focus is often on different metrics, but at $58.35 in late-Monday trading its 52-week range is $40.28 to $58.85.

Two-In-One, broken up: The Home Depot Inc. (NYSE: HD) reports on Tuesday morning and is a DJIA component, but for all practical purposes is a benchmark for the Lowe’s Companies Inc. (NYSE: LOW)which reports the following morning. Home Depot is far larger and more important due to size and being a DJIA stock. Estimates for Home Depot are $0.89 EPS and $19.17 billion in sales. Home Depot shares are up 31% so far in 2013 and its stock trades at 21.5-times expected earnings; Lowe’s stock is up 46% so far in 2013 and trades at 23.4-times expected earnings.

The TJX Companies Inc. (NYSE: TJX) is perhaps king of the discount retailers and it is on deck Tuesday morning before the market opens. This one is up almost 49% so far in 2013 and trades at almost 22-times expected earnings. Estimates are $0.74 EPS and $6.9 billion in revenue.

Deere & Company (NYSE: DE) is reporting earnings on Wednesday morning and is hard to expect any greatness after what Caterpillar and others have warned about when it comes to emerging markets. The ag-equipment maker traded at close to $84 in late-Monday trading against a 52-week range of $79.50 to $95.60, Deere also trades at only about 10-times expected earnings. Estimates are $1.89 EPS and $8.7 billion in revenue.

J. C. Penney Company Inc. (NYSE: JCP) is due on Wednesday morning. The retail giant is no market mover at all, but it is fighting for relevance and has many shareholders who are being battled by many short sellers as well. The company’s plan remains somewhat elusive and we are not sure how the analyst community will have accounted for that dilutive offering that brutalized an already battered shareholder base. Earnings estimates are -$1.72 EPS on $2.8 billion in revenue.

Pandora Media Inc. (NYSE: P) is another one that is not systemic at all but one which could be very volatile after earnings on Thursday. The digital online music company is now worth over 45 billion and shares have tripled from the lows. Estimates are expected to be $0.06 EPS and almost $175 million. It would seem to us that the company has to blow away expectations to keep the bulls happy here.

Target Corp. (NYSE: TGT) is the other huge retailer due with earnings and its report will be announced on Thursday before the market opens. Estimates are $0.63 EPS and almost $17.4 billion in revenue. Trading at about 17.2-times expected earnings, Target is lagging the market with gains of only about 14% so far in 2013.

The Gap, Inc. (NYSE: GPS) reports on Thursday after the close. Despite being range-bound of late, the stock is still up 37% year to date. It trades at just over 15-times expected earnings and is worth just under $20 billion in market cap. Gap remains a turnaround, but one successful turnaround. Estimates are $0.71 EPS and $3.98 billion in revenue.

Did Microsoft Just Pay $7 Billion for a New CEO?

The announced acquisition by Microsoft Corp. (NASDAQ: MSFT) of the mobile phone business of Nokia Corp. (NYSE: NOK) for $7.2 billion gives Microsoft a couple of things. First, is an internal candidate to replace retiring CEO Steve Ballmer. The other thing Microsoft gets is a firm grip on a hardware company that ranks second in global handset sales but that has seen its market share drop from over 40% to less than 15%.

Nokia CEO Stephen Elop now becomes the odds-on choice for the top spot at Microsoft. The peripatetic Elop spent three years at Microsoft as the head of its business (Office) division before taking over at Nokia. He'll be bumped down to executive vice-president now, until the acquisition by Microsoft is completed.

Elop did not create Nokia's troubles, but he didn't solve them either. According to Gartner Inc. (NYSE: IT), Nokia held a 14% share of the global mobile phone market at the end of the second quarter and sold nearly 61 million units, second only to Samsung Electronics which had a market share of almost 25% and sold more than 107 million units.

In terms only of smartphones, Nokia sells virtually all of the smartphones on the market that use Microsoft's Windows Phone operating system. That amounted to 7.4 million units in the second quarter. The good news is that the number was up 83% year-over-year. The bad news is that Microsoft's share totaled just 3.3% of the operating system market.

The 61 million Nokia phones shipped in the second quarter included nearly 54 million feature phones and the market for those is dropping quickly as cheaper smartphones come onto the market.

Elop's main contributions to Nokia have been the original deal with Microsoft, the cost-cutting at Nokia, and the buyout of Nokia Siemens Networks from joint venture partner Siemens AG (NYSE: SI) for $2.2 billion. Not a lot of those achievements have a lot to do with selling smartphones, unless you consider that the company started with zero smartphone sales when Elop arrived.

Zero to 7 million isn't nothing, but then, it isn't not much either and the path for growth really doesn't change much, no matter whether Nokia is independent or a division of Microsoft. Two China-based companies, Lenovo and ZTE, both sold more smartphones in the second quarter than did Nokia, and there are other Chinese companies, like Yulong and Xiaomi, that Microsoft/Nokia will have to contend with at the mid- to low-end of the market.

Nokia's Elop has proved he could slow, if not stop the bleeding, at Nokia, and he managed to push a number of new products out the door. Microsoft paid for a substantial bit of the marketing for those products and once the deal for Nokia is completed the Redmond giant will have to spend a lot more than it has in the past if it is serious about carving out a space in the smartphone market.

So, no, Microsoft did not pay $7 billion for a new CEO, but Stephen Elop likely has the inside track to prove that Microsoft can make a profit in a business that the company has yet to make an appreciable dent in.

Thursday, December 25, 2014

Apple Raises the Bar

The following video is from Wednesday's Investor Beat, in which host Chris Hill and analysts Jason Moser and Tim Hanson dissect the hardest-hitting investing stories of the day.

In an appearance at the All Things Digital Conference, Apple (NASDAQ: AAPL  ) CEO Tim Cook said that his company has "some incredible plans" and that his staff "has several more game changers" in the pipeline. Is Cook smart to raise expectations? The Apple CEO also said that he's not a fan of Google (NASDAQ: GOOG  ) Glasses. Will Google Glasses catch on with consumers? In our lead story on Investor Beat, Motley Fool One's Jason Moser and Motley Fool Asset Management's Tim Hanson weigh in on the battle between Apple and Google.

Apple has a history of cranking out revolutionary products... and then creatively destroying them with something better. Read about the future of Apple in the free report, "Apple Will Destroy Its Greatest Product." Can Apple really disrupt its own iPhones and iPads? Find out by clicking here.

The relevant video segment can be found between 0:18 and 2:26.

Are Shorts Watching Gray Television?

There's no foolproof way to know the future for Gray Television (NYSE: GTN  ) or any other company. However, certain clues may help you see potential stumbles before they happen -- and before your stock craters as a result.

A cloudy crystal ball
In this series, we use accounts receivable and days sales outstanding to judge a company's current health and future prospects. It's an important step in separating the pretenders from the market's best stocks. Alone, AR -- the amount of money owed the company -- and DSO -- the number of days' worth of sales owed to the company -- don't tell you much. However, by considering the trends in AR and DSO, you can sometimes get a window onto the future.

Sometimes, problems with AR or DSO simply indicate a change in the business (like an acquisition), or lax collections. However, AR that grows more quickly than revenue, or ballooning DSO, can, at times, suggest a desperate company that's trying to boost sales by giving its customers overly generous payment terms. Alternately, it can indicate that the company sprinted to book a load of sales at the end of the quarter, like used-car dealers on the 29th of the month. (Sometimes, companies do both.)

Why might an upstanding firm like Gray Television do this? For the same reason any other company might: to make the numbers. Investors don't like revenue shortfalls, and employees don't like reporting them to their superiors.

Is Gray Television sending any potential warning signs? Take a look at the chart below, which plots revenue growth against AR growth, and DSO:

Source: S&P Capital IQ. Data is current as of last fully reported fiscal quarter. FQ = fiscal quarter.

The standard way to calculate DSO uses average accounts receivable. I prefer to look at end-of-quarter receivables, but I've plotted both above.

Watching the trends
When that red line (AR growth) crosses above the green line (revenue growth), I know I need to consult the filings. Similarly, a spike in the blue bars indicates a trend worth worrying about. Gray Television's latest average DSO stands at 69.9 days, and the end-of-quarter figure is 67.9 days. Differences in business models can generate variations in DSO, and business needs can require occasional fluctuations, but all things being equal, I like to see this figure stay steady. So, let's get back to our original question: Based on DSO and sales, does Gray Television look like it might miss its numbers in the next quarter or two?

The raw numbers suggest potential trouble ahead. For the last fully reported fiscal quarter, Gray Television's year-over-year revenue shrank 3.1%, and its AR grew 2.1%. That looks ok, but end-of-quarter DSO increased 4.2% over the prior-year quarter. It was up 49.5% versus the prior quarter. That demands a good explanation. Still, I'm no fortuneteller, and these are just numbers. Investors putting their money on the line always need to dig into the filings for the root causes and draw their own conclusions.

Internet software and mass media are being consumed in radically different ways, on new and increasingly mobile devices. Is Gray Television on the right side of the revolution? Check out the changing landscape and meet the company that Motley Fool analysts expect to lead "The Next Trillion-dollar Revolution." Click here for instant access to this free report.

Add Gray Television to My Watchlist.

Wednesday, December 24, 2014

'Colbert Report' says goodbye with record ratings

Stephen Colbert: The Man vs. The Character   Stephen Colbert: The Man vs. The Character NEW YORK (CNNMoney) The Colbert Nation tuned in big time to say goodbye to "The Colbert Report."

On Thursday, 2.5 million viewers watched as Stephen Colbert ended his very popular satirical news show, "The Colbert Report."

This made the finale the most-watched episode in the show's history.

And that number may even grow considering that "The Report" was shown at 11:30 at night, and many viewers may watch the sendoff days later thanks to their DVRs.

After nine years, Colbert said goodbye to his patriotic pundit persona in grand fashion.

First by killing his guest, The Grim Reaper AKA Grimmy, and then riding off into the night with Santa Claus, Abraham Lincoln and Jeopardy's Alex Trebek.

colbert last show

However, Colbert wasn't the only one who said goodbye to the character.

In a nearly five-minute sing along to "We'll Meet Again," Colbert was joined by a stage full of people singing Colbert's persona off into the sunset.

This included the Daily Show's Jon Stewart, musician Randy Newman, ESPN's Keith Olbermann, actor Bryan Cranston, NBC's Tom Brokaw, New York City mayor Bill de Blasio, "Star Wars" director George Lucas, CNN's Christiane Amanpour, and even Sesame Street's Cookie Monster.

Colbert will be taking over the CBS "Late Show" from David Letterman sometime in 2015. The show will be owned by the network.

As for Comedy Central, it will fill Colbert's slot with the new "The Nightly Show starring Larry Wilmore" starting on January 19.

Tuesday, December 23, 2014

Micron Technology, Inc Is Doing a Billion-Buck Buyback. But Is This a Good Idea?

With the stock market at record highs, and Federal Reserve's Quantitative Easing program at an end, you might think investors would be starting to get nervous about stock valuations. But not everyone's nervous. Some seem downright ... excited!

Managers at corporations seem particularly happy to spend billions of dollars buying back their companies' own shares. For example, late last month, computer flash memory maker Micron Technology (NASDAQ: MU  ) announced plans to repurchase $1 billion worth of its own stock.

The announcement came just one month after Micron reported the close of a fiscal year that saw revenues grow dramatically, GAAP profits more than double, and cash profits increase fivefold over 2013 levels. That certainly sounds good and bolsters the case for buying back stock. But is this buyback plan as good as it sounds?

We attempt to answer that question ... by asking two more questions.

Can it pay?
With $4.5 billion in cash and equivalents, and a further $1.8 billion in longer-term investments, Micron has enough cash available to implement its entire $1 billion-strong buyback tomorrow, if it were of a mind to. What's more, with only $4.4 billion in long-term debt, Micron's stock shows a net-cash position on its balance sheet, such that rapidly implementing the buyback would not unduly affect the company's liquidity.

And it gets better. S&P Capital IQ data confirm that, over the past year, Micron generated more than $3 billion in positive free cash flow from its business. That was enough cash to back up 99.9% of the company's reported GAAP earnings. (That's something not all companies can say). So in theory, at least, Micron doesn't even need to dip into its savings to pay for its buyback. At its current pace of cash production, Micron can afford to buy back $1 billion in stock, and then $1 billion more after that ... and then $1 billion more after that. Every year.

Should it pay?
Granted, not all years are so kind to Micron stock as the past 12 months have been. Indeed, S&P Capital IQ data show that 2014 was the best year for cash production at Micron of any year out of the past five. Over that time span, the company has four times failed to generate even $1 billion in positive free cash flow -- and in one year, 2011, free cash flow actually ran negative.

So what we really need to ask is, now that Micron is flush with cash, is its stock cheap enough that it should be using that cash to buy back stock? And the answer to that question depends on whether the stock is cheap.

So here's how Micron stock currently compares with a couple of its bigger rivals.

Stock

P/E

Dividend Yield

5-Year Projected Growth Rate

Total Return Ratio

Micron

13.0

-

15%

0.9

SanDisk (NASDAQ: SNDK  )

19.3

1.3%

17.8%

1.0

Western Digital (NASDAQ: WDC  )

15.3

1.6%

6.7%

1.8

Peer comparisons from finviz.com.

From the perspective of a pure value investor -- one who agrees with master investor John Neff that you get your best values from buying companies whose P/E is no greater than the total return from a stock's earnings growth and dividend payouts -- Micron does indeed look like a nice bargain. Valued on P/E, Micron stock is significantly cheaper than SanDisk, despite growing nearly as quickly. And it's expected to generate a much better total return than is Western Digital, whose business actually leans more toward hard drives, but which is a player in flash as well.

Yet Micron stock carries a lower P/E than Western Digital does as well.

The upshot for investors
You might find it surprising to hear a value investor say that, despite having run up 80% over the past year, Micron is still a bargain today. But that's what the numbers tell me. So long as the growth estimates prove accurate, the company's strong earnings and just-as-strong free cash flow, combined with a rock-solid balance sheet, make Micron the stock to beat.

Apple Watch revealed: The real winner is inside
Apple recently revealed the product of its secret-development "dream team" -- the Apple Watch. The secret is out, and some early viewers are claiming that its everyday impact could trump the iPod, iPhone, and the iPad. In fact, ABI Research predicts that 485 million of this type of device will be sold per year. But one small company makes Apple's gadget possible. And its stock price has nearly unlimited room to run for early in-the-know investors. To be one of them, and see where the real money is to be made, just click here!


Monday, December 22, 2014

Walt Disney: The Parks & Resorts Segment Can Boost Revenue

Walt Disney a Media and Entertainment company that generates revenue from four main segments pertaining to media, entertainment and retail sector. Parks and Resorts segment for the company provides the major contribution to the consolidated revenue that is recorded to over 30%, with highest contribution provided by Media Networks. In the past the theme park industry underwent a chaotic season due to the global recession having a terrible impact on the industry as traffic reduced to such entertainment theme parks.

As the global recession rebounds, market analyst anticipates the revenue for the themes and amusement parks to grow in next 5 years. Various companies are now focusing on new attraction to entice more traffic to the park and boost the revenue. Walt Disney (DIS) is one such global leader that has been constantly adding new features to it various theme parks in an effort to redefine the entertainment experience at its various Themes and Amusement parks.

Quarter overview

The company recently released its third quarter results, and if observed closely all the revenue generation segments of the company recorded growth. The consolidated revenue was up by 8% year over year, to records $12,466 million as compared to $11,578 in the same terms last year.

Segmental Revenue

Segment

Revenue (Q3-2014)

Revenue (Q3-2013)

Contribution In Total Revenue

Growth

1

Media Networks

5,511

5,352

44.2%

3%

2

Parks & Resorts

3,980

3,678

31.9%

8%

3

Studio Entertainment

1,807

1,590

14.5

14%

4

Consumer Products

902

775

7.3%

16%

5

Interactive

266

183

1.5%

45%

Media network remained flat in terms of growth although it has major contribution to the consolidated revenue. Parks and resort segment which contributed around 32% to the consolidated revenue witnessed a growth mainly due to the higher traffic and increased spending budget of the visitor to the park. Growth in the Studio Entertainment segment was leveraged by increase in international distribution and the performance of Frozen, Captain America2 as compared to the theatrical distributions in the same quarter in the previous year. Higher comparable store sales were witnessed in the consumer product segments that influenced the 16% year over year growth. The interactive segment witnessed a growth due to strong demand for the game Disney Infinity.

New travel packages with Disney

At the start of the year 2015, Double Bucket List itinerary will be added to the adventure travelers list for an amazing experience in Amazon region. This package provides trip to the Amazon flooded with various adventures for the travelers. Families opting for this package will be taken to various adventure track of the Ecuadorian Amazon and will also explore the world famous Galapagos Islands. The company is all excited about this new package as it believes this to be the most adventures travel package announced as on date.

Furthermore, Disney also plans to launch new packages for traveler opting for long weekend trips. New itinerary is added for mini vacations, that includes New York City, San Francisco and Napa. The four days prolonged weekend trip will provide travelers to explore America's more preferred locations. These travel packages will be generally preferred by families and friends looking to take a short break from a regular hectic life.

More features in the Amusement parks

Animal Kingdom is one of the most preferred destinations in the Disney world, mainly by kids. It provides a connection between the nature and the living being for a great new experience for the travelers. Themes at the Animal kingdom are created from various block buster films to provide a real time experience to traveler based on the virtual world. At the start of this year, Disney had announced to add new features to its Animal Kingdom based on the block buster film "Avatar". The main feature added will be the ride on a Banshee. This feature is anticipated to provide a totally new experience to the travelers. The Pandora is estimated to be unveiled in 2017.

"One of the things guests tell us they love the most about our parks is their ability to step into amazing worlds that otherwise only exist in our imaginations or on films," Staggs said. He said, "Pandora is one of the most elaborate and captivating worlds ever caught on film. It celebrates the connections between nature and living things."

The company also plans to launch various new attractions at EPCOT. This attraction will be based on the hit movie "Frozen". The company expects this to be open for public in the year 2016. The fans of Frozen are eagerly waiting for this launch and will certainly provide a growth to the top line of the company in future.

Conclusion

As the global population continues grow and it has a directed impact on the travel and the entertainment industry. The budget allocated for travel expense has also witnessed growth with favorable economies that has led to increase in the market size of the travel and the entertainment industry. Keeping the growth pattern of the travel and the entertainment industry, Disney is more focused with its travel packages and features addition in the amusement park to attract more traffic which adds on to the revenue of the company. I feel, in the coming years, Disney is all set to achieve new heights and the stocks of this company can also soar benefiting the investors. As an investor, I would, certain try to include this stock in my portfolio considering the brand name Disney and it future growth plans.

Sunday, December 21, 2014

Do You Own These 5 Toxic Stocks? Watch Out!

BALTIMORE (Stockpickr) -- Mr. Market has been in correction mode this month, a long overdue changeup in the trajectory for stocks. The last time the S&P 500 made a meaningful price correction was back in February.

So far, this correction is looking pretty meaningful. Since the calendar flipped to August, the S&P has shed 3.48% -- which means that, in just two weeks, the big index has returned approximately half of its performance year-to-date. But there's an important distinction between a correction and a crash. Even though stocks are retracing in August, the primary uptrend in the S&P 500 is very much intact right now.

Read More: Warren Buffett's Top 10 Dividend Stocks

The same can't be said for many of its individual components, though.

Right now, some of the biggest names on Wall Street are looking toxic. And there's a pretty good chance you even own one or two of them. That's why, today, we're taking a technical look at five toxic stocks you should sell.

Just to be clear, the companies I'm talking about today aren't exactly junk. By that, I mean they're not next up in line at bankruptcy court. But that's frankly irrelevant; from a technical analysis standpoint, sellers are shoving around these toxic stocks right now. For that reason, fundamental investors need to decide how long they're willing to take the pain if they want to hold onto these firms in the weeks and months ahead. And for investors looking to buy one of these positions, it makes sense to wait for more favorable technical conditions (and a lower share price) before piling in.

For the unfamiliar, technical analysis is a way for investors to quantify qualitative factors, such as investor psychology, based on a stock's price action and trends. Once the domain of cloistered trading teams on Wall Street, technicals can help top traders make consistently profitable trades and can aid fundamental investors in better planning their stock execution.

So without further ado, let's take a look at five toxic stocks you should be unloading.

Read More: 8 Stocks George Soros Is Buying

LKQ

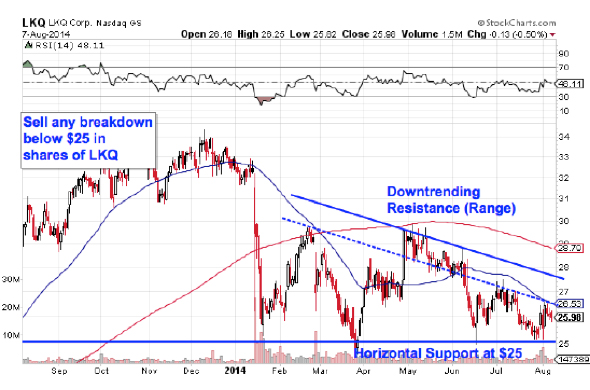
Auto parts maker LKQ (LKQ) hasn't exactly painted a pretty picture for investors year-to-date. Since the first trading session of 2014, shares of the $8 billion parts firm have slipped more than 21%. But that could just be the beginning. Here's why shares could be due for another leg lower in the second half of the year.

LKQ is currently forming a long-term descending triangle pattern, a bearish setup that's formed by horizontal support (down at $25) and downtrending resistance above shares. Basically, as LKQ has bounced in between those two important levels this year, it's been getting squeezed closer to a breakdown below that $25 price floor. When that happens, we've got our sell signal in shares.

The top of LKQ's price pattern has come in the form of a range, rather than a discrete level. For a sentiment shift big enough to unwind this bearish trade in LKQ, we'd need to see shares trade above the top of the range, currently at $28, before it was safe to be on the long side of this stock again. Otherwise, if $25 gets violated, look out below.

Read More: 4 Stocks Warren Buffett Is Selling in 2014

SL Green Realty


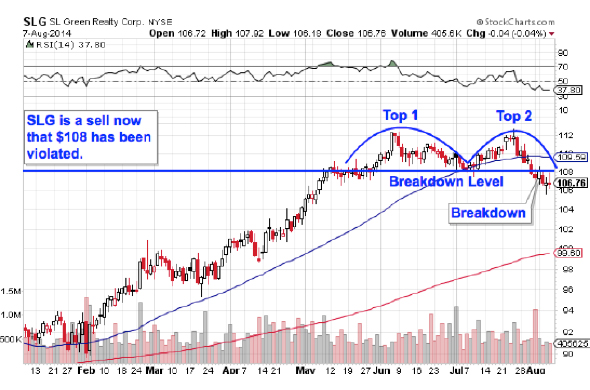
We're seeing another big breakdown trade in shares of $10 billion real estate investment trust SL Green Realty (SLG). Even though this stock has rallied hard this year, up more than 15% thanks to a flight to yield from earlier in 2014, shares are showing signs of a reversal this month.

SLG triggered a double top pattern at the start of this week, breaking down below key support at $108. The double top looks just like it sounds: It's formed by a pair of swing highs that top out at approximately the same price level. The sell signal comes on a violation of the support level that separates the tops, that $108 price floor in the case of SLG.

Why all of the significance at $108? It's not magic. Whenever you're looking at any technical price pattern, it's critical to keep buyers and sellers in mind. Patterns such as the double top are a good way to quickly describe what's going on in a stock, but they're not the reason it's tradable. Instead, it all comes down to supply and demand for shares.

Read More: 3 Huge Stocks to Trade (or Not)

That $108 level in SLG is the spot where there's previously been an excess of demand for shares. In other words, it's a price where buyers have been more eager to step in and buy shares at a lower price than sellers were to sell. That's what makes a breakdown below support so significant -- the move means that sellers are finally strong enough to absorb all of the excess demand at the at price level. Caveat emptor.

Tibco Software

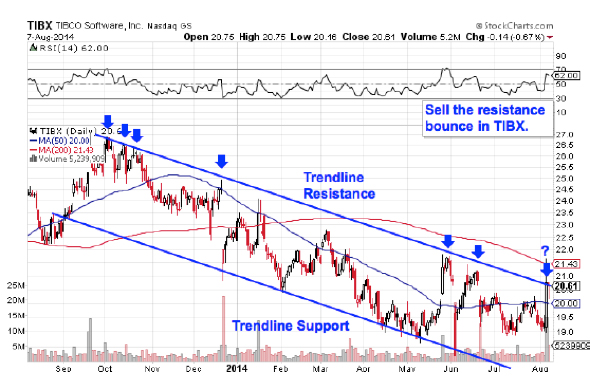
You don't need to be an expert technical trader to figure out what's going on in shares of mid-cap middleware and infrastructure software provider Tibco Software (TIBX); this chart is about as simple as they get. TIBX has been bouncing its way lower in a textbook downtrending channel since last September, and now, with shares coming off of resistance for a seventh time, it makes sense to sell the bounce lower.

That pair of parallel trend lines on Tibco's chart defined the high-probability range for shares of TIBX to trade within. And since those lines are pointing down and to the right, it makes sense to stay out of this stock in August -- it's really just as simple as that.

From here, it makes sense to sell the next trend line bounce lower in TIBX. Waiting for that bounce lower before clicking "sell" is a critical part of risk management, for two big reasons: it's the spot where prices are the highest within the channel, and alternatively it's the spot where you'll get the first indication that the downtrend is ending. Remember, all trend lines do eventually break, but by actually waiting for the bounce to happen first, you're confirming that sellers are still in control before you unload shares of Tibco.

Read More: 5 Stocks Insiders Love Right Now

Wells Fargo


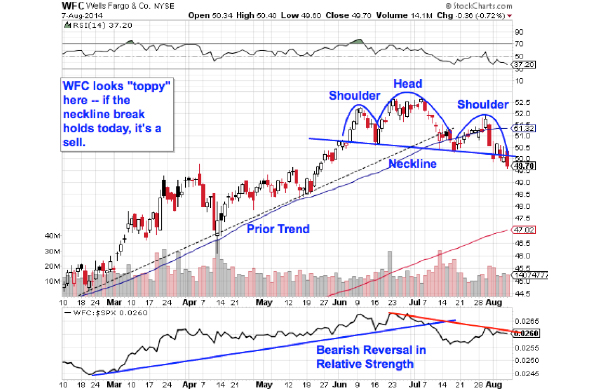
Wells Fargo (WFC) has been a strong performer so far this year. In fact, just a month ago, it was looking bullish. But that's changed. WFC is showing signs of a classic top on its chart, and now, it makes sense to take your gains.

Wells is currently forming a head and shoulders top, a setup that indicates exhaustion among buyers. The setup is formed by two swing highs that top out at approximately the same level (the shoulders), separated by a higher high (the head). The sell signal come with yesterday's close below the neckline level that defines the bottom of the head and shoulders pattern.

That bearish bet is being confirmed by relative strength in WFC. While the relative strength line had been in a bullish uptrend for most of the year, it broke at the beginning of July when Wells Fargo started underperforming the rest of the market. That's a big red flag to heed in shares this week.

Read More: 5 Rocket Stocks to Buy for Correction Gains

Google

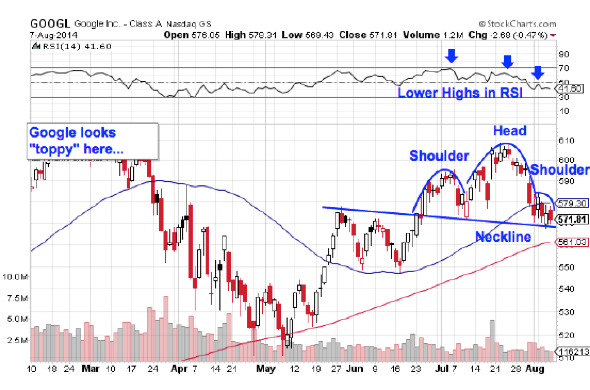
We're seeing the exact same setup in shares of Google (GOOG) right now. Like Wells, Google is forming a head and shoulders top – the big difference is that the sell signal in shares of this search engine giant hasn't triggered yet. That sell trigger happens if the neckline gets violated with a move below $570 in its class A shares, or $560 if you own class C shares through GOOG.

Momentum, measured by 14-day RSI, is the side indicator to look at in Google. Our momentum gauge has been making lower highs over the course of the head and shoulders setup, even though price made a higher high at the head. That's an indication that buying pressure is waning, even though Google's share price is around the same place as it was when the pattern began. Since momentum is a leading indicator of price, tactical investors should think about taking gains as soon as Google violates $570 in its class A shares (or $560 for GOOG).

Read More: 5 Tech Trades Ready to Move

Lest you think that the inverse head and shoulders is too well known to be worth trading, the research suggests otherwise: a recent academic study conducted by the Federal Reserve Board of New York found that the results of 10,000 computer-simulated head-and-shoulders trades resulted in "profits [that] would have been both statistically and economically significant."

That's good reason to keep a close eye on Wells Fargo and Google this week.

To see this week's trades in action, check out the Toxic Stocks portfolio on Stockpickr.

-- Written by Jonas Elmerraji in Baltimore.


RELATED LINKS:


>>4 Big Stocks on Traders' Radars


>>3 Stocks Spiking on Unusual Volume


>>5 Stocks Set to Soar on Bullish Earnings

Follow Stockpickr on Twitter and become a fan on Facebook.

At the time of publication, author had no positions in stocks mentioned.

Jonas Elmerraji, CMT, is a senior market analyst at Agora Financial in Baltimore and a contributor to

TheStreet. Before that, he managed a portfolio of stocks for an investment advisory returned 15% in 2008. He has been featured in Forbes , Investor's Business Daily, and on CNBC.com. Jonas holds a degree in financial economics from UMBC and the Chartered Market Technician designation.

Follow Jonas on Twitter @JonasElmerraji


Saturday, December 20, 2014

Potash Corp: Your Pain, Our Gain

UBS analyst Brian MacArthur and team explain why they upgraded Potash Corporation of Saskatchewan (POT) to Buy from Neutral today:

Potash Corp

Potash Corp is positioned to benefit from a significant ramp-up of low cost production through 2017 as its new Rocanville and Picadilly operations enter production. In the near-term the planned closure of Mosaic’s (MOS) Carlsbad operations in January 2015 and the current flood at Uralkali’s Solikamsk-2 mine could remove up to 2.4-3.4Mts of combined capacity from the market and provides the opportunity for Potash Corp to gain more volumes. Furthermore, this could also lead to higher pricing.

The current expansion at Rocanville and ramp-up at Picadilly will increase Potash Corp’s production capacity by nearly 4Mts and should contribute to materially lower costs. In addition, as these mines ramp-up through 2017 capex will decline and free cash flow should increase. In 2015 we expect free cash flow of ~$1.4B but even assuming flat pricing this could grow to $2.3B by 2017 as sustaining capex will drop to $800M per year.

Potash Corp’s dividend currently yields ~4% and we believe it provides downside protection given that the dividend can be funded even if potash prices remain flat. In fact over time we believe management may be able to return excess cash to shareholders through an increased dividend or further share repurchases.

Shares of Potash Corporation of Saskatchewan have gained 1.5% to $35.81 at 2:46 p.m. today, while Mosaic has risen 1.8% to $46.

Friday, December 19, 2014

Biggest Retirement Income Gap Seen for Oldest Pre-Retirees

Click to enlarge: The retirement income gap by age. Source: BlackRockOlder pre-retirees are furthest from being retirement-ready, according to a recent analysis  by BlackRock and the Employee Benefit Research Institute.

The younger the retiree, though, the better it looks.

According to the study, 55-year-olds with median income and retirement savings are on track to replace 69% of their pre-retirement income. Based on the idea that retirees will need to replace about 80% of their income in retirement in order to maintain their standard of living, these 55-year-old median workers are falling 14% short.

For older pre-retirees, the gap gets wider.

The study found that 64-year-olds with median income and retirement savings will be able to replace only about 59% of their income, less than 60-year-olds who have the potential to replace about 64%.

“U.S. workers closest to retirement, and with the least amount of time left to bulk up their savings, are the ones who have the most work to do,” wrote Chip Castille, head of BlackRock’s U.S. Retirement Group, on BlackRock's blog.

BlackRock focused on people in their last decade before the traditional retirement age of 65 that have the two primary sources of retirement income, Social Security and retirement savings, usually 401(k) plans and individual retirement accounts.

“The 26% gap that the median 64-year-old faces to replace 80% of pre-retirement income is more daunting,” wrote Castille. “And for workers who expect to make up at least some of the difference by staying on the job past age 65, it’s important to note that EBRI’s 2014 Retirement Confidence Survey has found that 49% of retirees left their jobs earlier than they had planned.”

Castille added one explanation for the larger gap for older pre-retirees is “workers in their 60s are far more likely to receive some sort of traditional pension to supplement their retirement.”

To assess the retirement readiness of pre-retirees, BlackRock used its CoRI Retirement Indexes and incorporated data on U.S. workers’ median income and retirement savings provided by the Employee Benefit Research Institute.

To estimate the Social Security retirement benefits at the “full retirement age,” BlackRock collected the median retirement savings balances of people the same ages who have 401(k) accounts and IRAs in EBRI’s database and used the BlackRock CoRIRetirement Indexes to estimate the retirement income that those savings could provide.

Launched last year, the CoRI Retirement Index series was developed to help investors age 55 and older plan for retirement by tracking the estimated cost of $1 of future, annual inflation-adjusted lifetime income beginning at age 65.

The analysis also found that the cost of future income for investors ages 55, 60 and 64 has risen since BlackRock began tracking the cost of future retirement income a year ago.

“For someone age 55, for example, every $1 of lifetime retirement income was estimated to cost $14.09 as of June 30 – a 7.15% increase from what that same income would have cost a 55-year-old a year ago,” the study said.

---

Related on ThinkAdvisor:

Wednesday, December 17, 2014

WTI Crude Oil on the Move $112 Next Stop

The energy sector has surged during the last two months which can be seen by looking at the XLE Energy Select Sector Fund. If crude oil continues to climb to the $112 level, XLE will likely continue to rally for another few days or possibly week as energy stocks are considered a leveraged way to play energy price movements.

Another way to look at this info is through the USO United States Oil Fund. This tracks much closer to the price of oil. The only issue is that many ETFs that "try to track" an underlying commodity is in how the funds are built. They own multiple contracts further into the future which does not exactly provide us with the short term news/event driven price movements in the current front month contract as they should.

What does this mumbo jumbo mean? Well, it means funds like USO and the highly respected UNG, and VIX ETFs… (just joking about the highly respected part), fail to track the underlying commodity or index very well when it comes to short term price movements. This means, you can nail the timing of a trade, and the commodity or index will move in your favor, yet your fund loses money, or goes nowhere…

Let's Focus on the Technicals Now…

WTI crude oil has formed a bullish ascending triangle pattern from March to May of this year. The breakout to the upside is bullish and should be traded that way until the chart says otherwise. This breakout and first pullback must hold, or I will consider it a failed breakout. So if price dips and closes 2 days below the breakout level, it will be a major negative for oil in my opinion.

The range of the ascending triangle provides us with a measured move to the upside which is $112. Typically the first pullback after a breakout can be bought. The first short term target to scalp some gains would be $109, and at that point moving your stop to breakeven is a wise decision. Trading is all about managing capital and risk, if you don't, then the market will take advantage of your lack in discipline.

Looking further back on the chart, you can see the double bottom formation also known as a "W" formation. Once the high of the "W" formation is broken the trend should be considered neural or up.

Also note that the RSI (relative strength) has been trending higher for some time now. This means money is rotating into this commodity. This is in line with my interview this week with Kerry Lutz and my recent article talking about the next bull market in commodities and the TSX (Toronto Stock Exchange).

clfutures

WTI Crude Oil Trading Conclusion:

In short, oil has some extra risk around it. The recent move has been partly fueled by news overseas. So at any time oil could get a lift or take a hit by news that hits the wires. I tent to trade news related events with much less capital than I normally do because of this risk.

Happy Trading!

WANT MORE TRADE IDEAS?
GET THEM HERE: WWW.THEGOLDANDOILGUY.COM

Chris Vermeulen
CEO & Founder
AlgoTrades.net
TheGoldAndOilGuy.com