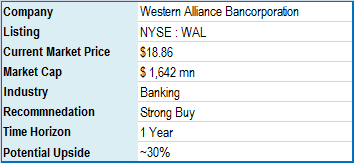
Investment Summary: This article is on Western Alliance Bancorporation (WAL), a growth-oriented commercial lender in the Southwest. The banks looks set to improve profitability supported by economic recovery in Last Vegas, industry-leading revenue performance and operating leverage supported by expense control. The credit profile of the bank looks excellent with limited exposure to residential mortgage and well poised to grow its loan portfolio by 20% annually over the next 3 years. It is also well set on a path to credit recovery with improving fundamentals that justifies premium valuation going forward.
Company Overview: Western Alliance Bancorporation is a multi-bank holding company with $8.6 bn in assets and operations spread across 41 locations. As of 6/30/2013 Western Alliance had:
Loan portfolio of $6.4 bnAsset base of 8.6 bnDeposit base of $ 7.0 bnPre-Tax Pre-Provision Income of $40.2 mnNet Income of $34.1 mnNIM of 4.36%It operates out of three main subsidiary banks and their details are as under:
(click to enlarge)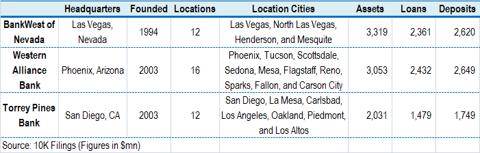
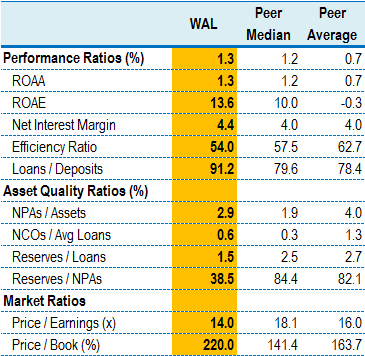
Western Alliance Bancorporation is the sole surviving community bank in Las Vegas to have weathered the brutal real estate meltdown in Arizona and Nevada and is now ready to restore top-tier profitability. Before discussing the key positive triggers, we will look into the key attributes that makes WAL fundamentally strong compared to its peers.
1. Commercial Driven Loan Portfolio with Potential To Grow At 20% : WAL has managed to grow its loan portfolio at 20% CAGR since its IPO in 2005. The bank had completed a total of 5 acquisitions (excluding the FED assisted ones) that contributed around 30% of the total balance sheet growth.
(click to enlarge)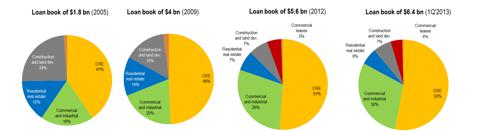 Source: Company Filings
Over the years, WAL has changed its loan origination strategy. Post crisis, WAL's i) loan growth has been driven by commercial real estate (CRE) and Commercial & Industrial loans (C&I), ii) Construction and development share of loans has reduced from 24% in 2005 to 7% in 1Q'2013 and iii) completely cessation of new loan origination in the residential mortgage segment.
WAL looks well positioned to grow its loan origination by close $1bn in 2013. This implies an 18% growth which we believe could be supported by $3 bn of originations, partly offset by $2 bn in run-off. Moreover growth in C&I segment is expected to outpace CRE, given the conservatively underwritten development deals that should help stabilize construction balances. Reflecting the same, shared national credits (SNCs) currently account for less than 5% of loans. The new loan origination are also of higher quality with i) passrated credits (1-5) representing 94% of the portfolio and ii) high pass (1-3) contributing 27% of the book (vs. 23% in 2Q'2012). The management had stated that majority of the new business over the past 6 months accrued from new hires who mainly refinanced their pervious customers.
2. Deposit Base That Benefit from Higher Rates & Additional Room to Grow: WAL has managed to grow its deposit base at 16% CAGR since its IPO in 2005. WAL looks well positioned to benefit from higher rates that should only increase the value of its deposits. Its ability to fund earning assets with core deposits would help improve the banks performance more meaningfully when short-term rates eventually rise.
(click to enlarge)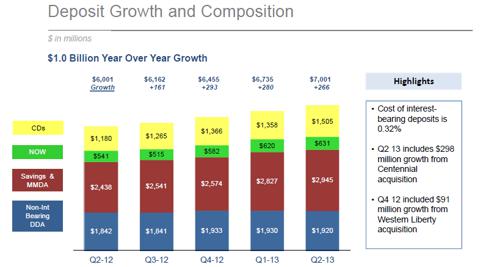
Source: Investor Presentation
Moreover its quality of deposits has improved over times given noninterest accounting for 27% of the total mix followed by interest bearing DDA (9%), savings / money market (42%), and CDs ( 21%). This shift along with lo! w rates h! as helped WAL reduce its cost of deposits to 0.32%.
(click to enlarge)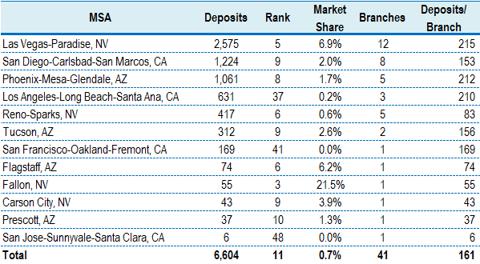
Source: Company Website
Other key highlight is that WAL looks well positioned from a growth standpoint. It has with low market share in Nevada (#6 or 7.0%), Arizona (#7 or 1.7%), and San Diego (#8 or 2.1%), increasing scope for more wins.
3: Funding from SBLF to Act as Low Cost Capital Source till 2016: The holding company owes $141 mn to the Small Business Lending Fund (SBLF), which is a program run by the U.S. Treasury. The program enables participating banks to repay federal bailout funds received through the Troubled Assets Relief Program (TARP). Western Alliance is the largest participant in SBLF and has certainly been meeting the goals of the program, by growing its commercial loan portfolio at a strong pace.
SBLF has turned out to be a very low-cost source of capital for Western Alliance. The dividend on the preferred shares held by the Treasury is just 1% for banks achieving an i) annual growth rate of 10% for commercial and industrial loans or ii) loans secured by owner-occupied commercial real estate to businesses with less than $50 mn in annual revenue. In April 2016, the annual dividend on SBLF preferred shares for all participants is set to increase to 9%. WAL could also pay back the SBLF with retained earnings before the reset date and still maintain Tier 1 capital in excess of 9.50% under Basel III norms.
4. Ability to Complement Growth with Value Accretive M&A: WAL has regained the regulators' confidence, as evidenced by its ability to close on two M&A deals since the crisis. Western Alliance has been very active in deal making over the past one year, acquiring 2 banks: Western Liberty and Centennial. Key highlights of the deal were i) deals priced at a discount to TBV and ii) earnings accretion in the first year of acquisition. Total net gains realized ($0.15 per share in 4Q! ' 2012 an! d $0.10 per share in 2Q' 2013) contributed to the 21% increase in tangible book value to $7.26 / share at the end of 2Q' 2013.
(click to enlarge)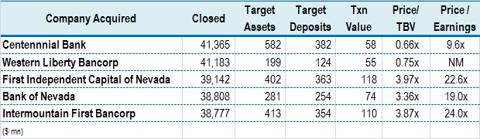
Source: Press Filings
Though acquisition targets at attractive valuation (deep discount to TBV) are rare under current circumstances, WAL is well place to bid given that it is trading at 2.5x TBV.
The Upside Triggers
Trigger 1 - Recovery in Credit to Act as Major Tailwind: WAL was badly affected during the credit crisis given its exposure to the construction, land development, and troubled commercial borrowers in the Nevada region. According to S&P/Case-Shiller, Las Vegas and Phoenix recorded one of the steepest declines in home prices during the credit cycle. San Diego also witnessed a fairly significant decline in home prices from peak to trough.
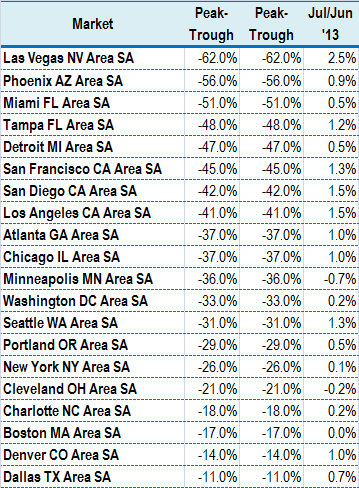
Source: S&P/Case-Shiller
WAL provisioning is down to 23 bps (after peaking at 504 bps in 3Q' 2009). On absolute terms, provision amount has fallen from $50 mn to $3.5 mn during the period. Classified plus watch and NPAs are also down to manageable 6.5% of loans (57% of TCE plus reserves) after reaching 19.2% of the portfolio (153% of economic capital in 2009). NPA's have fallen to 25% levels from the peak of 5.9% in 4Q' 2009.
Trigger 2 - Economic Recovery Underlying Las Vegas Strip: In 2012, Las Vegas tourism and gaming encountered significant headwinds in the form of weak national economy, the Euro zone crisis, and a slowdown of economic growth in Asian countries. However looking forward, signals point to a continuing recovery in Las Vegas tourism spending with scope for a robust acceleration from mid 2013 onwards. The state of Southern Nevada's tourist-based economy is reflected in a number of different indicators like i) Clark County visitor volume, ii) tot! al passen! gers at McCarran airport, ii) Las Vegas Strip gaming revenue and iv) Clark County taxable sales. Strong growth in all these areas is necessary for the Southern Nevada economy to do well for residents and businesses alike.
(click to enlarge)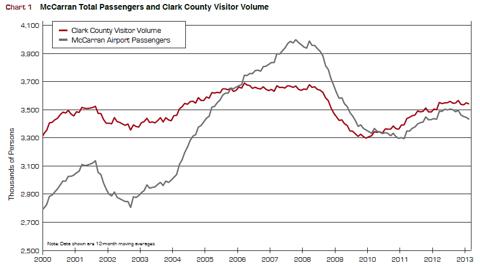 Source: Las Vegas Convention and Visitors Authority, McCarran International Airport
The total number of passengers passing through McCarran has increased 4.2% since hitting bottom in early 2011. The number of visitors to Southern Nevada increased 7.4% since hitting bottom in 2010.
(click to enlarge)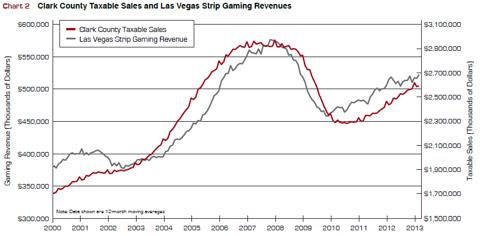 Source: Nevada Gaming Commission, Nevada Department of Taxation
Both Las Vegas Strip gaming revenue and consumer spending in Clark County have shown fairly strong growth in recent years. Although both took substantial hits in 2008, they have fared much better since late 2010. Gaming revenue on the Las Vegas Strip has increased by 13.9% since its bottom. Clark County taxable sales have increased by 14.1% since hitting bottom.
Trigger 3 - Visibility on the credit front and provisioning hitting a cyclical low: The new loan origination is of higher quality, with pass-rated credits (1-5) representing 94% of the total portfolio and high pass (1-3) accounting for 27% (vs. 23% in 2012). The shift toward a higher quality mix is underscored by having only $7.9 million or 2% of its cumulative NCOs since 2000 come from loans originated since the start of 2009. This implies that 95% ( $378 million) of its NCOs were derived from the 2004-08 vintages, a portfolio that is down to $1.5 billion or 25% of total loans outstanding.
(click to enlarge)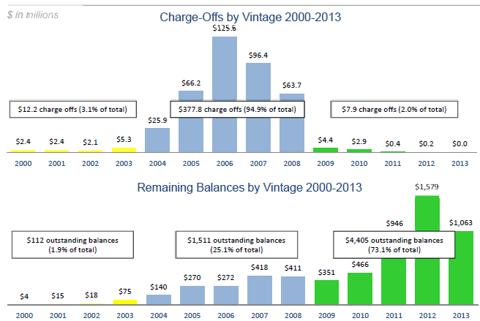
Source: Investor Presentation
Trigger 4 - Asset Sensitivity Increases with Higher Rates: Floating ! rate loan! s account for 45% of the total mix and WAL's balance sheet looks well positioned for higher rates. Any 100-400 bps increases in the curve would boost spread income by 0.1% to 6.8%. Though Fed is not expected to raise rates until 2015, wider spreads in the belly of the curve should help lessen margin pressure in the near term.
Trigger 5 - Steeper Curve to help Contain Margin Pressure: WAL has been able to hold up its net margins high at 4.7%, partially supported by purchase accounting associated with its 2 recent acquisitions. The stability in loan yields is expected to continue gives its ability to price products at premium in certain specialty lines of business like franchising, municipal lending and origination of complex esoteric deals. Though new loan origination at subpar yields could pressure margins, the rate of decline would slow going forward. However the total dollar net interest income looks poised to grow supported by higher volume which would be more than enough to offset pressure on asset yields. Also, the asset yield pressure could lessen as steeper curve would improve loan pricing mainly off the intermediate part of the curve and the reinvestment of cash flows off the securities portfolio.
Trigger 6 - Lifting of MOU's to Bring Expense Relief : Western Alliance had signed 5 MOU's with the regulators during the credit crisis. As a result of new capital raise, declining credit costs, strengthened underwriting, risk controls, improving profitability and liquidity, the last MOU was lifted in July 2013. This could translate to cost savings from regulatory compliance (like the $2 mn of relief in FDIC insurance costs).
Trigger 7 - Operating Leverage to Improve Profitability Further: WAL's operating ROA has increased to 1.23% in 2Q'2013 supported by lower credit cost, growing revenues and muted expense growth. Going forward, VAL's pre-tax, pre-provision earnings (PTPP) could improve to 2.14% as a result of operating leverage. The loan growth is poised to show double digit growth! , while e! xpense growth could decrease due to lower regulatory and credit-related costs. Efficiency ratios could also fall below 50% levels as a result of its commercial focus and small branch network. This can be considered as baby steps to achieve management's long term PTPP ROA of 2.3%.
Need for Premium Valuation
With a market capitalization of just over $1.5bn, WAL is a true mid-cap opportunity. Western Alliance currently trades at i) 30% discount to 2014 earnings and ii) 35% premium on P/B value relative to the broader small cap bank group.
I strongly believe that WAL needs to trade at a premium due to the following reasons.
Strong and stable balance sheet with capacity to grow loan book at an annual pace of 20% over the next 3 yearsAbility to generate improve PTPP to 2.5%Scope to become more efficient and bring down efficiency ratio to below 50% levels andCapability to do value accretive M&A deals at attractive valuationsA premium multiple is warranted as these trends would continue into the near future as well. According to Nasdaq compilation of 2013 earnings estimates growth, WAL is project to grow its EPS by 68% (vs. Industry average of 9%) to $1.32. Even applying the industry average p/e multiple of 18.1x, translates to a price target of ~$24, which implies at 30% upside from the current price levels.
Stock Downside Risk
Investors buy into this stock for its above average growth prospects. I personally believe that the market is factoring a loan growth of 15%+. Though the bank looks set to grow its loan portfolio by 20%, any slowdown on this front could hurt earnings.Any slowdown of the economic recovery in Nevada, Arizona and the San Diego MSA could negatively impact WAL's growth prospects and underlying credit profile.Conclusion: Last but not the least, the stock has seen strong interest from the hedge fund community. At the end of 2Q' 2013, a total of 18 of th! e hedge f! unds tracked by Insider Monkey were bullish in WAL, change of 64% from 1Q' 2013. Top 5 hedge funds with position in Western Alliance are Citadel Investment Group, Royce & Associates, Renaissance Technologies, Sirios Capital Management and Millennium Management. Western Alliance Bancorporation is the sole surviving community bank in Las Vegas to have weathered the brutal real estate meltdown in Arizona and Nevada and is now ready to restore top-tier profitability. WAL is an excellent play on the impending recovery of the Las Vegas economy and real estate with improving credit metrics and excellent earnings growth
Source: Western Alliance Bancorporation: Compelling Growth Story With Multiple Upside TriggersDisclosure: I have no positions in any stocks mentioned, and no plans to initiate any positions within the next 72 hours. I wrote this article myself, and it expresses my own opinions. I am not receiving compensation for it (other than from Seeking Alpha). I have no business relationship with any company whose stock is mentioned in this article. (More...)
No comments:
Post a Comment