BALTIMORE (Stockpickr) -- Stocks have been steamrolling their way to new highs this week, finally breaking out of the sideways slump that's plagued markets since March. But while most investors pull out the champagne, not everything is headed for higher ground.
>>5 Stocks Under $10 Set to Soar
In fact, some big-name stocks look downright toxic as we head into June.
To make the most of the restarted rally in stocks, it's critical to unload the names that aren't working right now. So today, we'll take a closer technical look at five stocks that are starting to look toxic -- and exactly what conditions need to get hit for the sell signal to trigger.
Just to be clear, the companies I'm talking about today aren't exactly junk. By that, I mean they're not next up in line at bankruptcy court. But that's frankly irrelevant; from a technical analysis standpoint, sellers are shoving around these toxic stocks right now. For that reason, fundamental investors need to decide how long they're willing to take the pain if they want to hold onto these firms in the weeks and months ahead. And for investors looking to buy one of these positions, it makes sense to wait for more favorable technical conditions (and a lower share price) before piling in.
>>Warren Buffett Is Sick of These 4 Stocks
For the unfamiliar, technical analysis is a way for investors to quantify qualitative factors, such as investor psychology, based on a stock's price action and trends. Once the domain of cloistered trading teams on Wall Street, technicals can help top traders make consistently profitable trades and can aid fundamental investors in better planning their stock execution.
So, without further ado, let's take a look at five "toxic" stocks you should be unloading.
Guess?
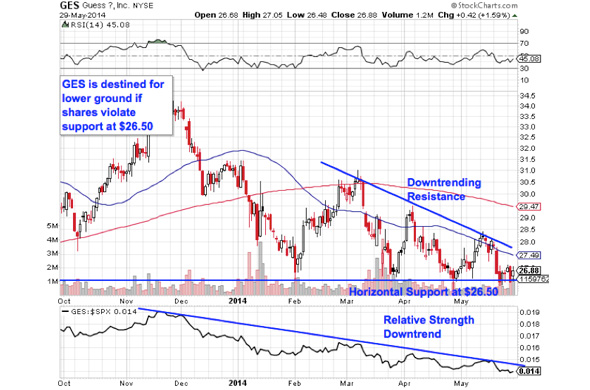
First up is apparel stock Guess? (GES), a name that's been no stranger to downside in the past year. In the last six months alone, GES has dropped more than 21%. The bad news for long-suffering shareholders is that the selling isn't likely over in Guess; this stock still looks toxic right now. Here's what to look for.
>>2 Oversold Stocks Ready to Bounce Higher
Guess is currently forming a descending triangle pattern, a bearish price setup that's formed by a horizontal support level below shares and downtrending resistance to the upside. Basically, as GES bounces in between those two levels, it's getting squeezed closer and closer to a breakdown below support at $26.50. When that happens, we've got a sell signal for this stock.
Relative strength adds some extra evidence for downside in GES. The relative strength line has been trending lower since last November, an indication that this stock isn't just dropping, it's also dramatically underperforming the rest of the broad market in the process. Since relative strength is statistically a very good predictor of price action on a rolling three-to-ten month time horizon, it's a red flag worth watching closely in June.
GES doesn't become a high-probability sell until $26.50 gets taken out.
Becton Dickinson
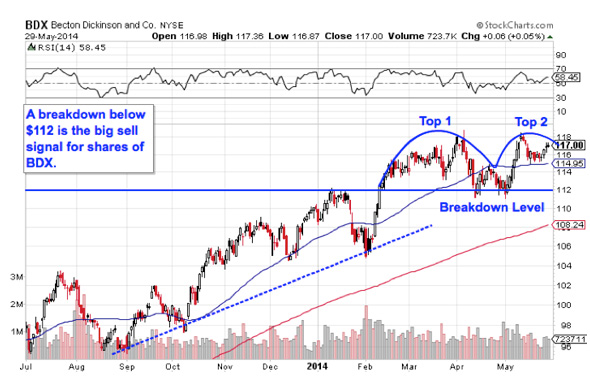
Medical device maker Becton Dickinson (BDX) hasn't been the kind of underperformer that Guess has been. In fact, BDX is actually up 16% in the last 12 months, keeping pace with an S&P 500 index that's been in rally mode. But now, Becton is showing signs of a conditional top.
>>4 Big Stocks on Traders' Radars
Becton is currently forming a double top, a bearish reversal pattern that looks just like it sounds. The double top is formed by a pair of swing highs that max out at approximately the same price level. The sell signal comes when the trough that separates the two highs gets violated. For BDX, that breakdown level is right at $112. If $112 gets taken out, it's time to be a seller.
What makes $112 matter? Whenever you're looking at any technical price pattern, it's critical to keep buyers and sellers in mind. Patterns like double tops are a good way to quickly describe what's going on in a stock, but they're not the reason it's tradable. Instead, it all comes down to supply and demand for shares.
That horizontal $112 level in Becton is the spot where there's previously been an excess of demand for shares; in other words, it's a price where buyers have been more eager to step in and buy shares at a lower price than sellers were to sell. That's what makes a breakdown below support so significant -- the move means that sellers are finally strong enough to absorb all of the excess demand at the at price level.
Teck Resources
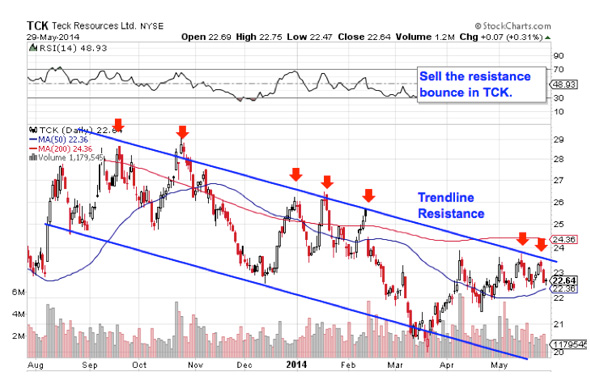
Luckily, you don't need to be an expert technical trader to figure out what's going on in $13 billion resource stock Teck Resources (TCK). A quick glance at the chart should tell you everything you need to know. In short, Teck looks toxic right now.
>>5 Stocks Insiders Love Right Now
TCK is currently bouncing its way lower in a textbook downtrending channel. The setup is formed by a pair of parallel trend lines: a resistance line above shares, and a support line below them. Those two lines on the chart provide traders with the high-probability range for TCK's shares to stay within. When it comes to trend channels, up is good and down is bad; it's really as simple as that.
And as shares bounce off of trend line resistance for a seventh time in this short span, it makes sense to sell the bounce. For value investors, the setup in Teck is tough to watch. After all, as this stock works its way down the channel, it's becoming cheaper from a fundamental standpoint. But it's important not to try to buy shares "on the cheap" until trend line resistance gets taken out -- this stock could get a lot cheaper still.
United Continental Holdings
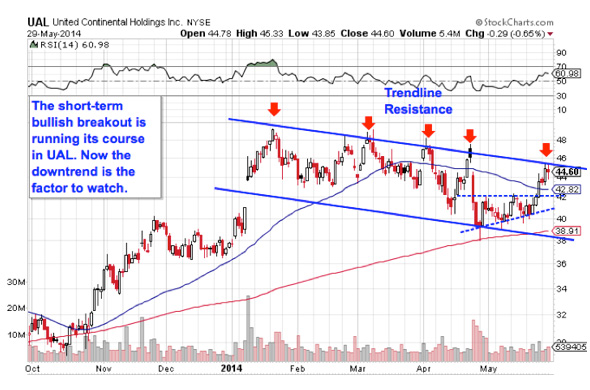
Airline stocks have been going strong for the last year and change, outperforming the rest of the broad market handily. But United Continental Holdings (UAL) has been the laggard of the group, failing to turn out the same performance that its peers have. And now, while the rest of the airline industry is still on fire in 2014, UAL is suffering from smoke in the cockpit.
Like Teck, UAL is currently forming a downtrending channel. The last time I highlighted the technicals in UAL, shares were looking bullish in the short-term -- but with the bullish breakout running its course this week, it makes sense to take gains here and sell the bounce off of trend line resistance.
Waiting for that move down before clicking "sell" is a critical part of risk management, for two big reasons: it's the spot where prices are the highest within the channel, and alternatively it's the spot where you'll get the first indication that the downtrend is ending.
Remember, all trend lines do eventually break, but by actually waiting for the bounce to happen first, you're confirming that sellers are still in control before you unload shares of UAL.
American Express
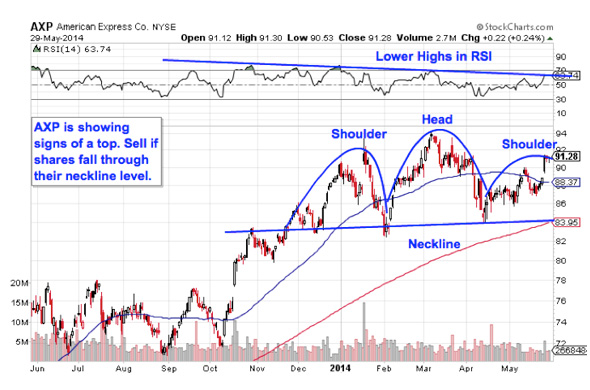
Last up is American Express (AXP), the $97 billion financial firm. After rallying more than 21% in the last year, AmEx is starting to show signs of a top in shares. Here's how you should trade the sentiment shift:
American Express is currently forming a head and shoulders top, a setup that indicates exhaustion among buyers. The setup is formed by two swing highs that top out at approximately the same level (the shoulders), separated by a higher high (the head). The sell signal comes on a move through AXP's neckline, which is currently right at $84. If shares violate that price level, it makes sense to sell (or short) this financial giant.
Momentum, measured by 14-day RSI, provides some foreshadowing for the downside in AXP. While AmEx's price has been slowly moving higher, momentum has been making lower highs and bleeding off. That's a big red flag. Short sellers should keep a protective stop just above the 50-day moving average.
To see this week's trades in action, check out the Toxic Stocks portfolio on Stockpickr.
-- Written by Jonas Elmerraji in Baltimore.
RELATED LINKS:
>>5 Large-Cap Stocks for All-Time Highs
>>5 Stocks Set to Soar on Bullish Earnings
>>3 Big Stocks Getting Big Attention
Follow Stockpickr on Twitter and become a fan on Facebook.
At the time of publication, author had no positions in stocks mentioned.
Jonas Elmerraji, CMT, is a senior market analyst at Agora Financial in Baltimore and a contributor to
TheStreet. Before that, he managed a portfolio of stocks for an investment advisory returned 15% in 2008. He has been featured in Forbes , Investor's Business Daily, and on CNBC.com. Jonas holds a degree in financial economics from UMBC and the Chartered Market Technician designation.Follow Jonas on Twitter @JonasElmerraji
No comments:
Post a Comment