BALTIMORE (Stockpickr) -- It's time to take a closer look at the tech sector. Despite a slow start to the year, tech stocks have started working in recent months. So, as Mr. Market hits the gas into the final corner of 2013, it makes sense to take a closer technical look at five breakout trades shaping up in technology stocks right now.
For the unfamiliar, technical analysis is a way for investors to quantify qualitative factors, such as investor psychology, based on a stock's price action and trends. Once the domain of cloistered trading teams on Wall Street, technicals can help top traders make consistently profitable trades and can aid fundamental investors in better planning their stock execution.
Without further ado, let's take a look at five technical setups worth trading now.
ChannelAdvisor
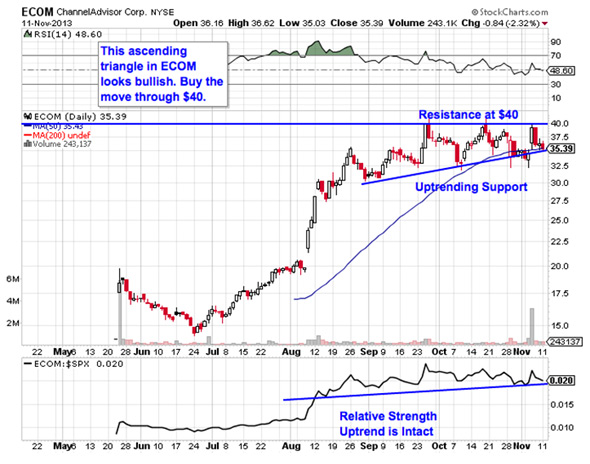
Cloud software provider ChannelAdvisor (ECOM) has enjoyed a stellar run since its IPO earlier this year. In the months since ECOM started trading at the beginning of the summer, shares have nearly doubled. But this stock could be headed for even higher ground before the calendar flips over to 2014.
That's because ECOM is currently forming an ascending triangle pattern, a bullish price setup that's formed by a horizontal resistance level above shares at $40 and uptrending support to the downside. Basically, as ECOM bounces in between those two technically significant price levels, it's getting squeezed closer and closer to a breakout above resistance. When that happens, we've got a buy signal in shares.
ChannelAdvisor has shown investors excellent relative strength all the way up this year, but it's worth noting that the uptrend in ECOM's relative strength line has remained intact even while the ascending triangle has been forming – that's a big sign of strength in this market. I'd recommend buying on a move through $40, from there, keep a protective stop at the 200-day moving average.
Computer Sciences
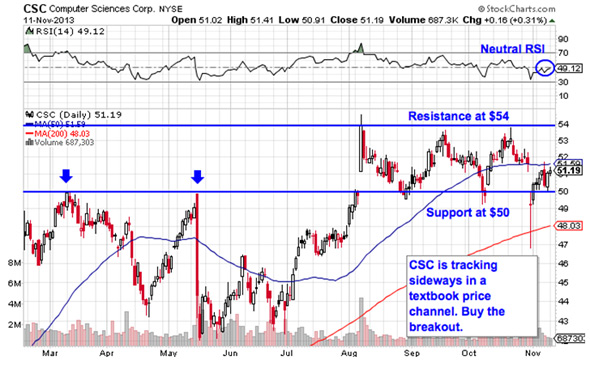
$7.6 billion IT services firm Computer Sciences (CSC) has been doing some consolidating of its own for the last few months. Shares have been stuck trading between resistance at $54 a share and support down at $50 a share since mid-July. But despite its sideways bent, there's a trade to be made in CSC right now.
Right now, CSC is forming a rectangle pattern, a consolidation setup that's formed by a pair of horizontal resistance and support level at those $54 and $50 price levels. The rectangle pattern gets its name because it basically "boxes in" shares between those two levels. The signal to watch is the break outside of that box. Support at $50 has some extra strength because it's a level that was previously a ceiling for shares back in March and again in May. That's not uncommon for a round number like $50, but it makes an upside breakout a lot more likely from here.
Momentum, measured by 14-day RSI, has moved into neutral mode in the last week, clearing the way for upside without the risk of shares becoming overbought. If shares of CSC can hold a bid above $54, it's time to buy.
ANSYS
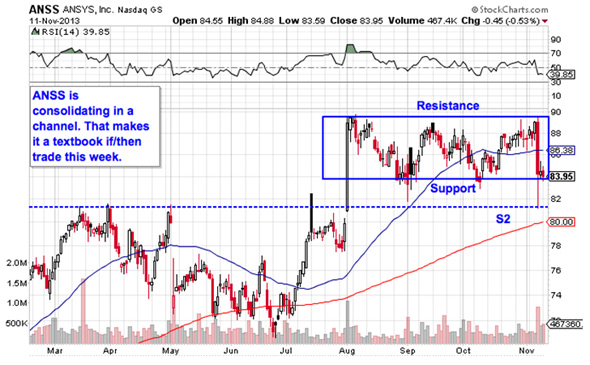
We're seeing the exact same setup in shares of simulation software maker ANSYS (ANSS). Like CSC, ANSYS is sandwiched between a horizontal price ceiling above shares around $90 a share and a similar horizontal floor at $83.50 a share. From here, the trading signal comes on a breakout outside of the channel.
Whenever you're looking at any technical price pattern, it's critical to think in terms of those buyers and sellers. Rectangles, triangles, and other pattern names are a good quick way to explain what's going on in a stock, but they're not the reason it's tradable – instead, it all comes down to supply and demand for shares.
That $90 resistance level is a price where there has been an excess of supply of shares; in other words, it's a place where sellers have been more eager to step in and take gains than buyers have been to buy. That's what makes a breakout above it so significant – the move means buyers are finally strong enough to absorb all of the excess supply above that price level. Don't be early on this trade.
Guidewire Software
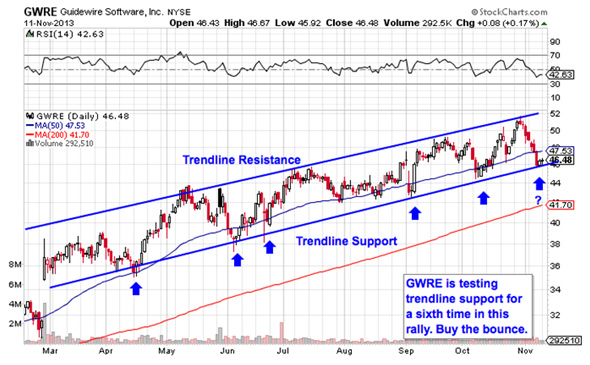
It doesn't get much more simple than the setup in shares of Guidewire Software (GWRE). You don't have to be an expert technical analyst to figure out what's going on in this stock. All it takes is a quick look at the chart.
Guidewire is currently trending higher in a well-defined price channel, a setup that gives us a high probability price range for GWRE's shares to trade within. Now, with shares sitting at trendline support, we're coming on a timely buying opportunity; buying at support has proven prescient each of the last six times GWRE has tested the support level that it established in March. But it's still critical to wait for the bounce in shares.
Buying off a support bounce makes sense for two big reasons: it's the spot where shares have the furthest to move up before they hit resistance, and it's the spot where the risk is the least (because shares have the least room to move lower before you know you're wrong). Remember, all trend lines do eventually break, but by actually waiting for the bounce to happen first, you're ensuring the Guidewire can actually still catch a bid along that line.
Agilent Technologies
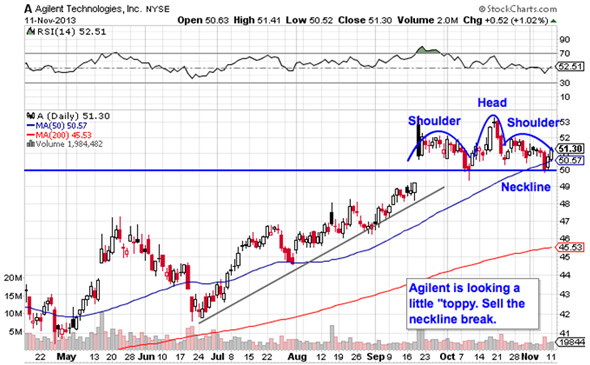
Last up is Agilent Technologies (A), a stock that's starting to look toppy after a 25% run higher year-to-date.
Agilent has spent most of the year making its way higher in 2013, but the uptrend really accelerated back in July, pushing shares in a straight line to their 52-week high of $53.47 a share. Even though shares are sitting just a couple bucks away from that high-water mark, the head and shoulders top pattern in shares should give buyers some pause right now.
The head and shoulders is formed by two swing highs that hit their head around the same level (the shoulders), separated by a higher high (the head). The sell signal comes on a move through the neckline, which is currently right at $50, a crucial round-number support level for this stock. If Agilent can't hold support at $50, it's time to unload (or short) shares.
Lest you think that the head and shoulders is too well known to be worth trading, the research suggests otherwise: a recent academic study conducted by the Federal Reserve Board of New York found that the results of 10,000 computer-simulated head-and-shoulders trades resulted in "profits [that] would have been both statistically and economically significant." That's good reason to keep this stock in your crosshairs in the days ahead.
To see this week's trades in action, check out the Technical Setups for the Week portfolio on Stockpickr.
-- Written by Jonas Elmerraji in Baltimore.
RELATED LINKS: >>5 Breakout Trades Under $10 >>3 Tech Stocks Spiking on Big Volume >>Buy These 5 REITs to Cash In This Year
Follow Stockpickr on Twitter and become a fan on Facebook.
At the time of publication, author had no positions in stocks mentioned.
Jonas Elmerraji, CMT, is a senior market analyst at Agora Financial in Baltimore and a contributor to TheStreet. Before that, he managed a portfolio of stocks for an investment advisory returned 15% in 2008. He has been featured in Forbes , Investor's Business Daily, and on CNBC.com. Jonas holds a degree in financial economics from UMBC and the Chartered Market Technician designation.
Follow Jonas on Twitter @JonasElmerraji
No comments:
Post a Comment